Platform
Reports & dashboards
Open Verna and know where the business stands: pipeline by stage, collections against schedule, agent performance, and occupancy, all reading from the same records your team works in. No exports to reconcile, no Friday reporting scramble.
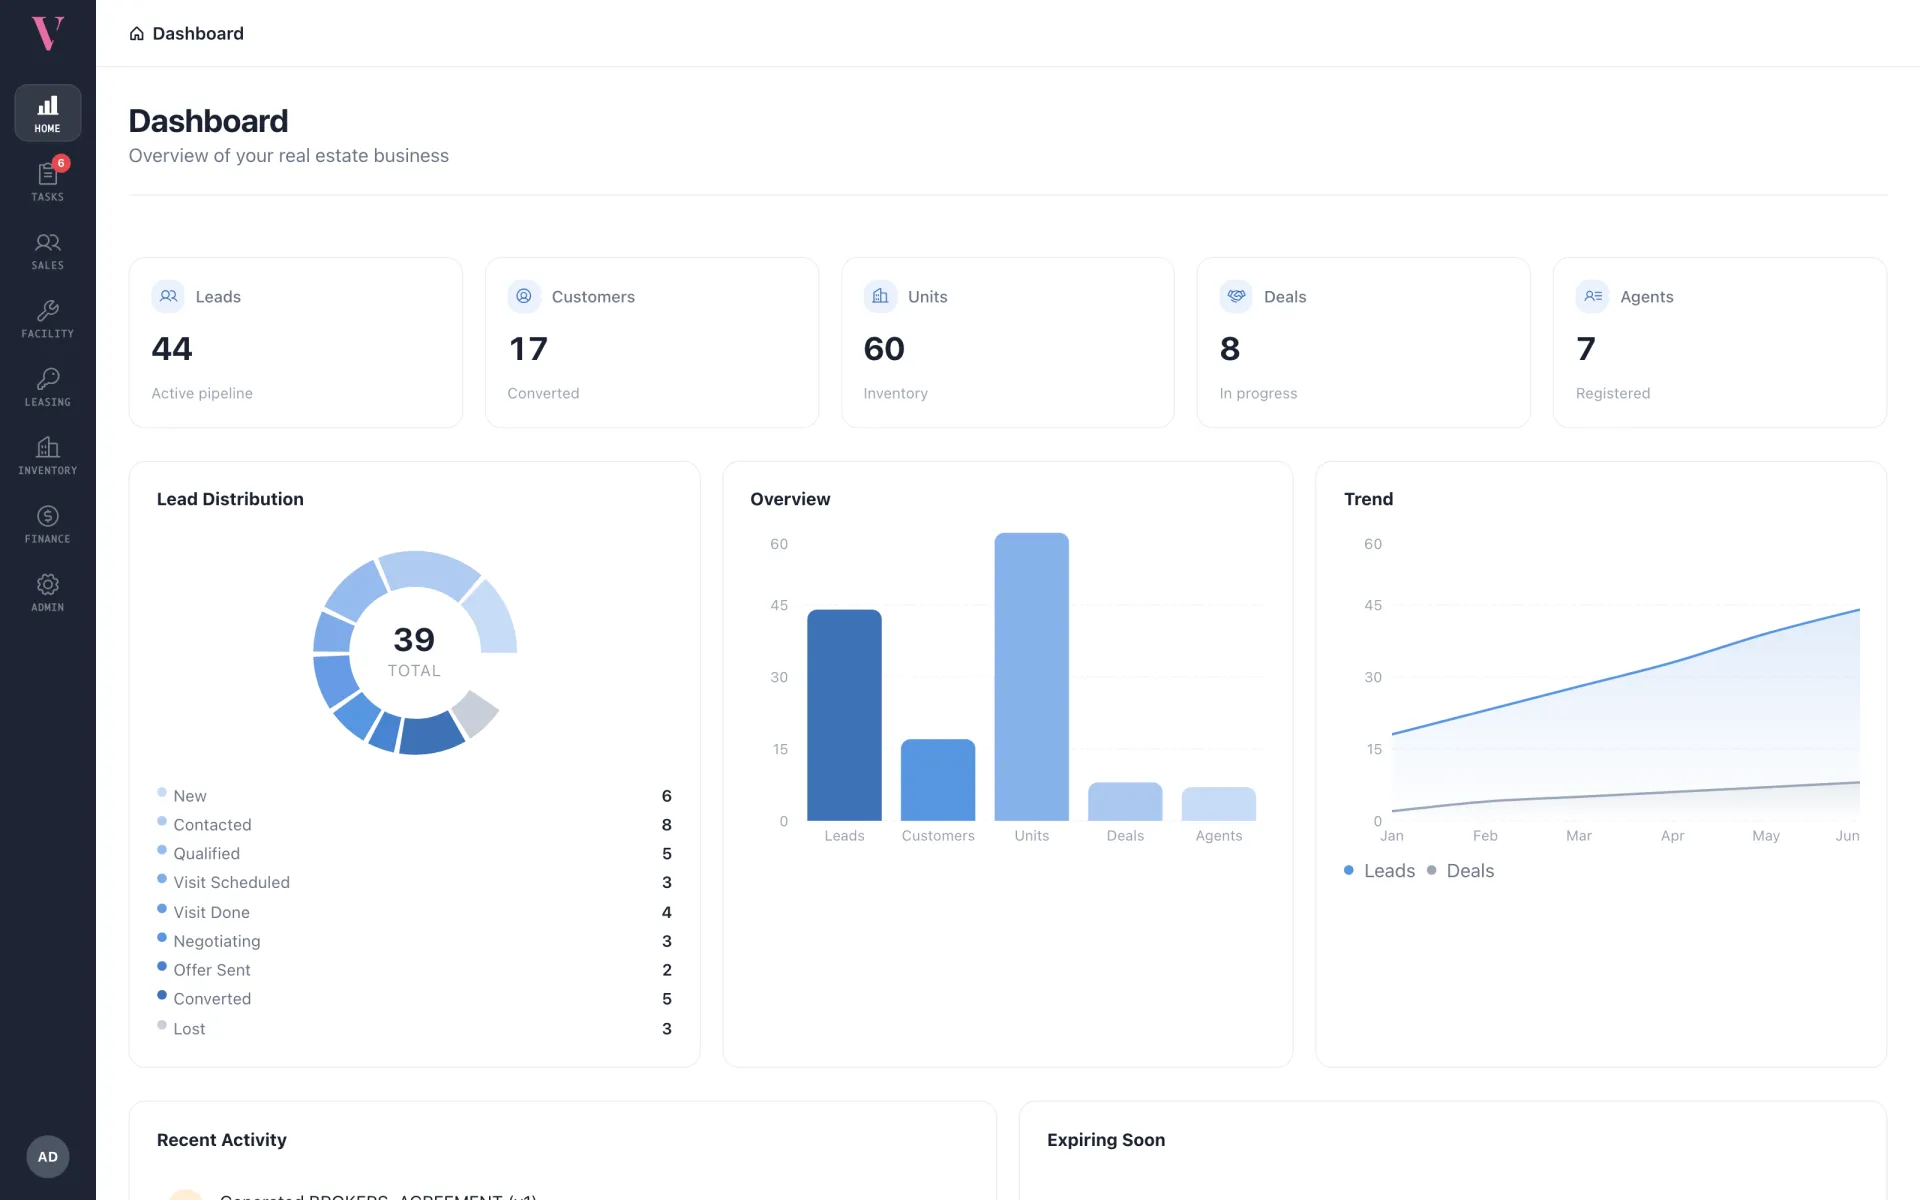
Numbers straight off the system of record
Role-aware dashboards
Agents open to their own book, managers to their team, directors to the whole company. Everyone sees live numbers scoped to what they actually run.
Pipeline & conversion
Lead status breakdowns, conversion rates by source and agent, and deal value in motion. See where the pipeline thickens and where it leaks.
Financial statements
Trial balance, profit & loss, balance sheet, and per-account ledgers generate on demand from the double-entry ledger, scoped per company for consolidation.
Team performance
Per-agent reports over any date range: leads handled, conversion rate, commission earned and paid, and a month-by-month trend. Broker admins get a leaderboard.
Excel exports
Any list view exports to Excel with the columns you see on screen. Exports are gated to senior roles, so bulk data leaves the system only when it should.
Audit trails
Every approval, status change, and edit is logged with who and when. When a number looks off, you can trace it to the action that produced it.

Get started
Ready to retire the Friday report?
Give every role a live view of the numbers they own.